Rural Service Area - Principles and General Procedures
|
|
Rural (Normative) Service Areas / IsolinesIn order to determine the normative service area a radius is drawn around a settlement (village, town or urban centre). The radius represents the service facility according to the distance. For example, the service radius of a small health clinic maybe 5 km while that of a district hospital could be as much as 40 km. |
|
|
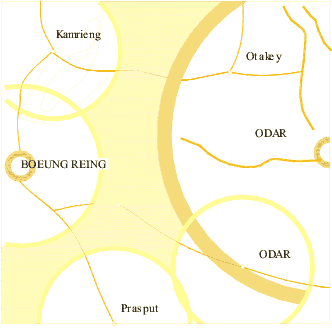
Step 1:Determine the important services that should be spatially depicted Step 2:Determine the acceptable service area for the specific service Step 3:Draw a radius around the settlement for each respective service that the planner wishes to depict. Map 1: Example of normative radius of a service area for a selected facility  |
 |
Possible forms of interpretation rural service centres:
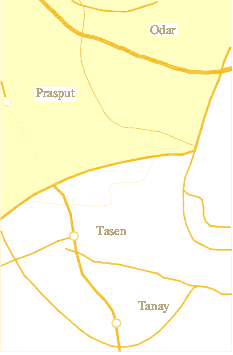
Map 2: Mapping of areas outside effective isoline of rural centres
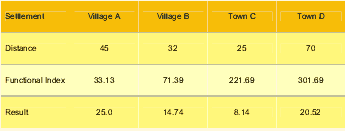
Accessibility analysisAccording to the gravitation hypothesis, it is assumed that inhabitants living at any point between two settlements A and B will be attracted to the towns accordance with the relative attractiveness of the towns and inversely with the distance. Step 1:Identify all the settlements to be analysed, including the neighbouring settlements. Step 2:Identify the distance (in km) to each settlement (d). For this it is possible to use the results of the distance matrix method. Step 3:Determine the functional index (C). The results of the functional index method should be used. Step 4:Compute the break even point (km)
Table 1: Results of calculation (example only)
Step 5:Alternatively it is possible to use the population instead of the functional index. Step 6:The alternative model calculation would be:
Table 2: Results of calculation (example only)
Map 3: Mapping of service area (example only)
|
 |
However, in many cases a simplified description of the step-by-step process is always possible. |


