|

|
GIS analysis with respect to central and marginal areas can be undertake, when the following data is available:
- A digital elevation model (DEM), which is mostly developed from digitised elevation contour lines of existing topographic maps. This forms the basis of Slope and Exposion maps, and can be futher used to develop a hillshading map, which facilitates map interpretation.
- A land cover map, which includes the forces and frictions which makes an area more or less accessible (e.g. it takes more time to pass through a dense forest than an open field).
- A number of spatial data sets of the selected infrastructure, which depends on the aspects which are relevant for centrality analysis. Most of the spatial data can be extracted from the topographic or other maps, otherwise surveys using GPS can help additionally. Infrastructure data sets can include:
- Asphalt roads,
- Gravel roads,
- Market places,
- Rural administrative units,
- Water points,
- Churches,
- Clinics,
- Schools,
- Agricultural Extension bureaus,
- Milk processing facilities, etc.
- The selection criteria listed above depends on the planning demand as well as on the availability or feasibility of acquiring spatial data.
Using GIS (e.g. ARC/INFO, ArcView and Idrisi), models can be developed to produce maps on central and marginal areas based on the above listed data. Figure 1 shows a GIS model where selected datasets have been processed into a centrality map.
Figure 1: GIS model for developing a map of central / marginal areas

|
|

|
Most important in this model is, that for every infrastructure item listed on top of figure 1, a centrality map is processed, taking the following into account:
- All vector data have to be converted to raster data, as this type of modeling can only be done on raster basis.
- Moving in space incurs costs. Different land cover types imply that different efforts have to be spent to get access to a certain infrastucture, due to frictions.
- Accordingly, the slope also implies frictions and forces. For the GIS model, friction values have to be estimated for land cover types and slope gradients.
- The direction of the slope aspect affects the effort needed to cross an area. A friction map can be generated by the additive overlay of an aspect image and a reverse aspect image, whose direction of movement corresponds with the friction of slope gradients.
Finally, all centrality maps are merged together using a multiplication or weighted addition of centrality layers. This forms the basis of a centrality map, which, can be draped over a hillshading and improved through additional vector layer.
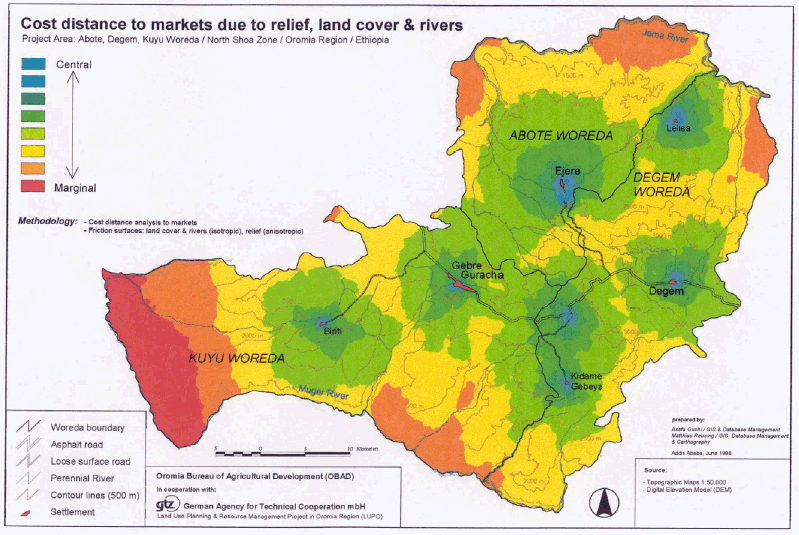
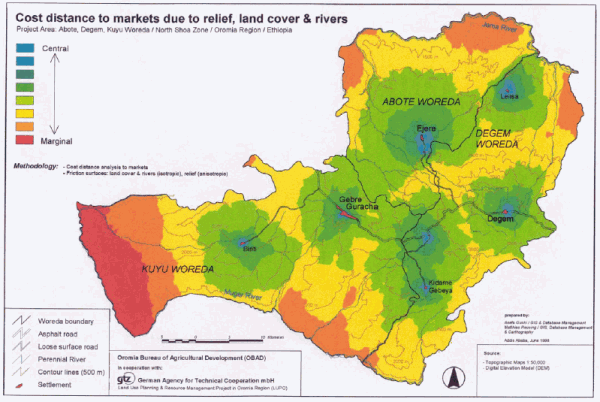
Map 1: Cost Distance to markets
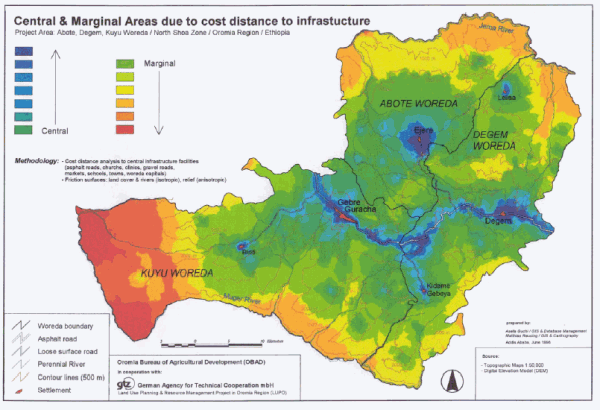
Map 2: Central & Marginal areas due to cost distances
|